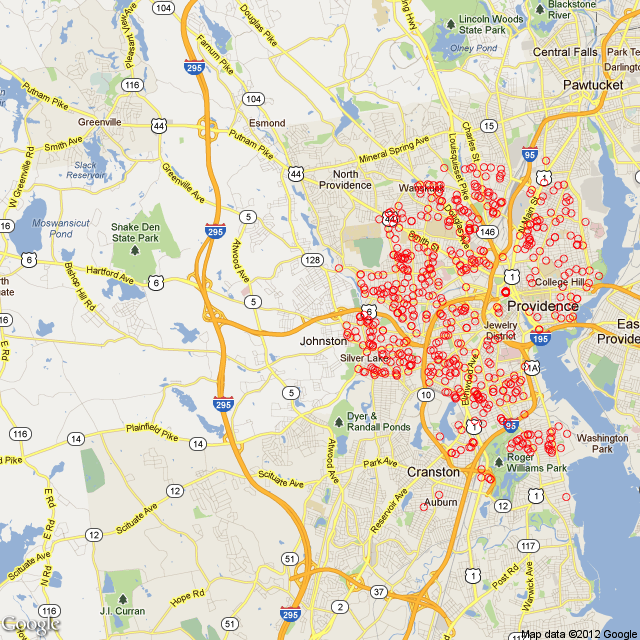
The past few months I’ve been learning how to use R. This morning, I decided to try out two first– importing a table of data that is being read of the web and overlaying location data onto a map.
With a little bit of Google skills and just enough R know-how I was able to produce this image:

There were a few things that were kind of tricky for me. First, for sometime I couldn’t get latitude and longitude components for the addresses. I figured there was something wrong with the way I was using the *apply class of functions in R. apply() (and the related class of functions lapply, sapply, etc.) are really handy if a bit tricky for beginning R users. This function permits quickly “applying” a function across multiple elements. Traditionally this is done with a loop, but the apply() functions “vectorize” this process (R folks always talk about making your code more vectorized which has something to do with the structure of objects in R but is beyond my computer science skills– essentially, vectorized code runs much faster and more efficiency than loops because of some underlying feature of the language). After playing around with apply, lapply, and sapply, I decided to move back into my “old” way of thinking and just write a loop:
 1
 2
 3
 4
 5
 6
 7
 8
 9
10
|
latlongroll <- function(address){
  lat <- vector(mode = "numeric", length = length(address))
  lng <- vector(mode = "numeric", length = length(address))
  for(i in 1:length(address)){
    latlong <- gGeoCode(address[i])
    lat[i]<-latlong[1]
    lng[i]<-latlong[2]
  }
  return(cbind(lat,lng))
}
|
This still didn’t work– I kept on getting a strange out-of-bounds call. So I decided to go down the rabbit hole of regular expressions and try and see if I could clean up my addresses any further (I couldn’t). So, now seemed as good a time as any to figure out how to print to the console while a loop is running to keep track of progress and where exactly my function was stopped. This turned out to be a bit tricky because I didn’t know you had to include a tricky line, r flush.console() in order to get the prints to work. When I figured this out I found out my loop was being caught on my 7th element, a perfectly well formed address. When I ran gGeoCode() on that address only it worked fine. So I thought, maybe Google is bouncing me out because I’m hitting it too fast? And bingo, the final (working version):
 1
 2
 3
 4
 5
 6
 7
 8
 9
10
11
12
13
|
latlongroll <- function(address){
 lat <- vector(mode = "numeric", length = length(address))
 lng <- vector(mode = "numeric", length = length(address))
 for(i in 1:length(address)){
  print(i)
  flush.console()
  latlong <- gGeoCode(address[i])
  lat[i]<-latlong[1]
  lng[i]<-latlong[2]
  Sys.sleep(0.5)
 }
 return(cbind(lat,lng))
}
|
Other than that, the whole process was pretty straight forward. I have to thank Tony Breyal for posting the functions I used to get latitude and longitude on Stack Overflow. Also, I found the RgoogleMaps vignette to be very helpful, although I wish it had slightly better explained what was going on in qbbox().
Finally, my full source for the above:
 1
 2
 3
 4
 5
 6
 7
 8
 9
10
11
12
13
14
15
16
17
18
19
20
21
22
23
24
25
26
27
28
29
30
31
32
33
34
35
36
37
38
39
40
41
42
43
44
45
46
47
48
49
50
51
52
53
54
55
56
57
58
59
60
61
62
63
64
65
66
67
68
69
70
71
72
|
# Providence Real Estate Transactions over the last 40 days.
# Required Packages
require('XML')
require('RCurl')
require('RJSONIO')
require("RgoogleMaps")
# Functions
# Construct URL required to get the Lat and Long from Google Maps
construct.geocode.url <- function(address, return.call = "json", sensor = "false"   ) {
 root <- "[maps.google.com/maps/api/...](http://maps.google.com/maps/api/geocode/)"
 u <- paste(root, return.call, "?address=", address, "&sensor=", sensor, sep = ""   )
 return(URLencode(u))
}
# Now that we have the proper Google Maps address, get the resulting latitude     and longitude
gGeoCode <- function(address) {
 u <- construct.geocode.url(address)
 doc <- getURL(u)
 x <- fromJSON(doc,simplify = FALSE)
 lat <- x$results[[1]]$geometry$location$lat
 lng <- x$results[[1]]$geometry$location$lng
 return(c(lat, lng))
}
# Roll through addresses to create lat long
latlongroll <- function(address){
# Initializing the length of a vector dramatically speeds up the code. Far
# better than reassigning and resizing each time in the loop.
 lat <- vector(mode = "numeric", length = length(address))
 lng <- vector(mode = "numeric", length = length(address))
 for(i in 1:length(address)){
# I kept the print in because this function takes a long time to run so I
# like  to watch its progress.
 print(i)
 flush.console()
# To reduce the calls, I chose to store lat and long locally before
# separating the two whereas initially I hit Google for each separately
 latlong <- gGeoCode(address[i])
 lat[i]<-latlong[1]
 lng[i]<-latlong[2]
# I'll have to experiment with the sleep time. I'm certain 0.5 seconds is
# too long (and this is the bulk of the time spent on the whole code).
 Sys.sleep(0.5)
 }
 return(cbind(lat,lng))
}

# Open to the most recent real estate transactions for Providence on the
# Projo
site <- '[www.providencejournal.com/homes/rea...](http://www.providencejournal.com/homes/real-estate-transactions/assets/pages/real-estate-transactions-providence.htm')
# Read in the table with the header as variable names.
realestate.table<-readHTMLTable(site,header=T,which=1,stringsAsFactors=F)
# Remove the $ sign before the price
realestate.table$Price <- gsub("([$]{1})([0-9]+)", "\\2",
                               realestate.table$Price)
# Cast price character as numeric
realestate.table$Price<-as.numeric(realestate.table$Price)
# Cast date string as date type (lowercase %y means 2-digit year,
# uppercase is 4 digit)
realestate.table$Date <- as.Date(realestate.table$Date,format='%m/%d/%y')
# Dummy transactions or title changes have a price of $1, removing those
# from data set
providence <- subset(realestate.table,Price>1)
# Removing properties that do not have an address that start with a street
# number
providence <- subset(providence, grepl("^[0-9]+", providence$Address))
# Add lat and lng coordinates to each address
providence<-cbind(providence, latlongroll(providence[,3]))
# Calculate boundary lat and long for map
bb <- qbbox(providence$lat, providence$lng)
# Gets a map from Google Maps
map <- GetMap.bbox(bb$lonR, bb$latR, zoom=12, maptype="mobile")
# plot the points
PlotOnStaticMap(map,lon=providence$lng,lat=providence$lat)
|
